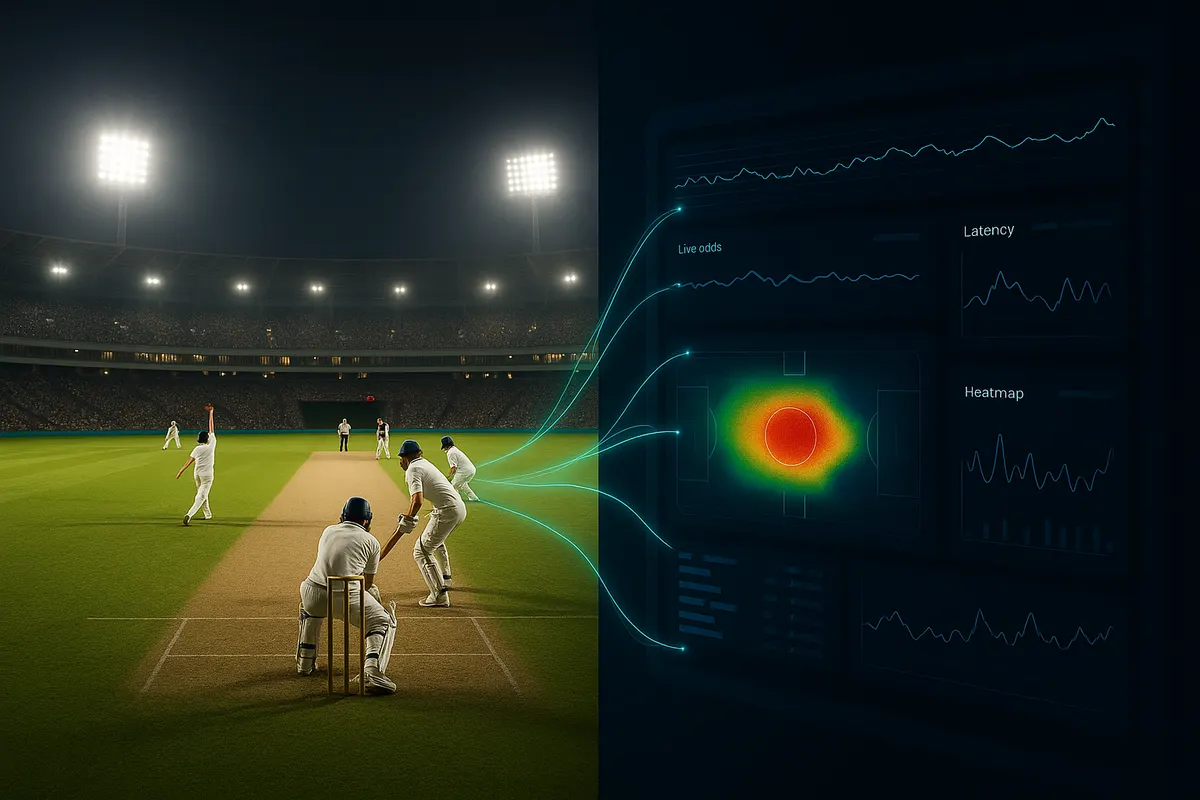
Why does your betting app seem to know what you want before you do?
Because it has been watching. Sports betting data analytics is the practice of collecting event data, market data and user behaviour data, then feeding it into pricing models, recommendation engines and interface decisions. The bet slip you see on your phone is not a neutral menu of options. It is the visible output of a pipeline that starts with a scout in a stadium and ends with a product manager reading a retention cohort.
My argument is simple: over the past decade the competitive battleground in betting shifted from who offers the most markets to who understands their audience fastest. Sportradar and DraftKings sit on opposite ends of that chain, one supplying the data layer, the other building the consumer experience on top of it. Understanding how both work tells you a lot about what you are actually looking at when odds flicker during an over, and it tells you where the margin sits.
What sports betting data analytics actually means
Strip away the jargon and there are three distinct data streams doing the work:
- Event data — what is happening in the game, captured ball by ball or possession by possession, often within a second or two of the real action.
- Market data — how prices are moving across the industry, how much money is landing on each side, and how odds at one bookmaker compare with another.
- Behavioural data — what individual users do inside the app: which sports they open, how long they browse, when they abandon a bet slip, which notifications they ignore.
Every meaningful product decision in modern betting comes from combining those three. Event data prices the market. Market data protects the margin. Behavioural data decides what gets pushed to the top of your screen. Companies invest heavily here for an unglamorous reason: retaining an existing user costs far less than acquiring a new one, and analytics is how retention gets engineered.
Sportradar’s audience data strategy sits upstream of everything
Sportradar is a business-to-business data and technology supplier. Most bettors never see its name, yet it touches the numbers they bet into. Its model rests on official data rights with leagues and federations, collection infrastructure in venues, and analytics products sold back to bookmakers, broadcasters and the leagues themselves.
Real-time market intelligence
Speed is the product. Data is captured in-venue through a mix of trained human scouts and automated tracking, then distributed through low latency feeds that bookmakers plug directly into their pricing engines. That feed is what allows an in-play cricket market to reopen between deliveries instead of staying suspended for a minute.
On top of the raw feed sit trading services. Sportradar publicly offers managed trading and odds services, meaning a bookmaker can effectively outsource the pricing and risk management of thousands of simultaneous markets to models rather than to a human trading desk. The models ingest historical results, live event state, and how money is flowing, then adjust prices continuously. When you see a price move against you seconds after a wicket falls, you are watching that loop close.
Behavioural pattern analysis
The same infrastructure powers two other things. First, integrity monitoring: Sportradar built its reputation partly on anomaly detection, comparing odds movements across a large sample of bookmakers to flag betting patterns that do not match what is happening on the field. Suspicious drift gets escalated to governing bodies. Sports bodies including cricket administrators have used external integrity monitoring of this kind for years.
Second, audience analytics. Sportradar also sells marketing and audience products that help operators and rights holders segment fans, model which users resemble their most engaged customers, and target media accordingly. That is the less discussed half of sportradar audience data: the same behavioural modelling that spots an unusual betting pattern also tells a marketer which fan segment is most likely to open an app during a Test match afternoon.
DraftKings’ engagement-first approach
DraftKings came out of daily fantasy sports, and it shows. Its product instincts are built around participation rather than pure price competition, and that shaped how it uses data.
Personalised betting recommendations
Recommendation systems in betting apps work much like they do in streaming. The model looks at what you have wagered on, what similar users wagered on next, and what you engaged with but did not complete, then reorders the homepage. The practical result is a front page that is different for a Premier League follower and an NBA follower, with featured bet tiles, suggested parlay legs and prefilled stake amounts tuned to your past behaviour.
Same game parlay builders are the clearest example of engagement-led design. They bundle correlated selections from one match into a single high-multiplier bet. They are popular because they feel like fan knowledge expressed in a bet slip. They also carry a larger built-in margin than a single straight wager, because the operator prices the correlation between legs. That trade-off is worth knowing before you tap “add to bet slip”.
Live event integration
Second-screen behaviour drives the rest. Push notifications timed to a match starting, live score widgets inside the app, and cash-out valuations that update as the game state changes all exist to keep the session open. Cash out is itself a pricing product: the figure offered is the current model value of your bet minus the operator’s margin, which is why accepting it early almost always costs you a slice of expected value.
How engagement actually gets measured
Operators do not judge features on vibes. They run controlled experiments and read a standard set of metrics.
| Metric | What it measures | How it shapes the product |
|---|---|---|
| Cohort retention | Share of users still active weeks after signup | Onboarding flow, first-bet friction, notification cadence |
| Session depth and length | Screens viewed and time in app per visit | Live scores, streams, widget placement |
| Bet frequency and bets per session | How often users place wagers | Quick-bet tiles, prefilled stakes, in-play prompts |
| Bet slip abandonment | Selections added but never confirmed | Checkout design, odds change handling |
| Hold percentage | Operator revenue as a share of amount wagered | Market mix, parlay promotion, pricing margin |
A/B testing ties them together. Two versions of a screen go live to split audiences, and the one that moves the chosen metric wins. Nothing about that process is aimed at improving your returns, and no operator claims it is.
Live betting technology is where the pipeline becomes visible
In-play is the most data-hungry part of betting and the clearest demonstration of what analytics changed. A single T20 over can generate a fresh set of prices six times. Three mechanics deserve attention:
- Dynamic odds. Prices recalculate on every state change: a wicket, a boundary, a rain delay. The model reprices, the app refreshes, and the market reopens.
- Suspension and latency management. Markets freeze for a moment around key events so the operator is not taking bets on information it has not processed yet. Your feed is almost always a few seconds behind the stadium.
- Micro-markets. Next-ball outcomes, next-over runs, next-wicket method. These only exist because granular event data arrives fast enough to price them, and they turn a three-hour match into hundreds of separate decisions.
Our guide to how live betting markets work goes deeper on suspension, latency and cash-out mechanics if you want the nuts and bolts.
What the transformed betting fan experience means for you
Honestly assessed, the gains are real but one-sided. You get a faster, cleaner interface, markets that stay open longer, live data and sometimes streams in the same app, and a homepage that surfaces the sports you actually follow instead of a directory of 40 leagues. In-play depth in cricket and football is far beyond anything available a decade ago.
What has not changed is the maths. Every market carries an overround: add up the implied probabilities of all outcomes and they exceed 100%, and the excess is the operator’s margin. Better data makes pricing more accurate, which generally means tighter, harder-to-exploit markets, not softer ones. Personalisation increases how much you play, not what you win. Over time the negative expected value holds. Treat analytics-driven features as a better viewing and browsing experience, not an edge.
What this looks like in Indian markets
India is a cricket-first, mobile-first, bandwidth-conscious audience, and data-led products get adapted accordingly: ball-by-ball micro-markets during IPL and international fixtures, lightweight app builds, regional language interfaces, and payment flows designed around instant UPI-style rails rather than cards. The fantasy sports boom already trained tens of millions of Indian users to read player-level statistics before making a selection, which is exactly the behaviour recommendation engines feed on.
Expect more of the same: deeper cricket data, personalised in-play prompts, and analytics-driven onboarding. One caveat matters more than any product trend. India’s legal position on real-money online betting is contested and shifting, with central rules tightening and state laws differing significantly. Check what applies where you live before you deposit anything, and read our notes on how betting technology is evolving alongside how odds and margins are calculated.
Frequently asked questions
How does Sportradar use data?
It collects official event data from venues, distributes it through low latency feeds, prices and manages betting markets for operators through automated trading services, monitors odds movements across bookmakers to flag integrity risks, and sells audience segmentation tools to operators and rights holders.
What is DraftKings’ engagement strategy?
Personalisation and participation. Recommendation models reorder the app around each user’s habits, parlay builders turn fan knowledge into single high-multiplier bets, and live widgets plus timed notifications keep sessions open during matches. Features are validated through A/B testing against retention and session metrics.
How does data change the betting experience?
It makes interfaces personal, keeps in-play markets open through more of the match, adds micro-markets and cash-out valuations, and improves pricing accuracy. It does not reduce the house margin, which remains built into every price.
If betting stops being entertainment, use the deposit limits, session reminders and self-exclusion tools your platform is required to provide. Set a budget before you open the app, not after.